
Abstract
Trace: User request to /checkout
  ├── Span: API Gateway handler
  ├── Span: Auth service call
  ├── Span: Payment service call
  │     ├── Span: External Stripe API
└── Span: Inventory service call- A DAG of spans that represents the execution path of a single request across services.
- Once we identify the span for latency, we can proceed with optimisation
- We can use tools like Datadog APM, Tempo and Zipkin etc
How traces are sent to a server
Step 1: Instrumentation
- Code is instrumented (manually or via auto-instrumentation libraries) to emit trace data whenever requests, DB queries, RPC calls, or background jobs happen.
- Each unit of work generates spans.
Step 2: Local collector/agent (optional but common)
- Instead of sending traces directly, the app often sends spans to a lightweight agent or collector running on the same host/container.
- Protocols used: OTLP (gRPC/HTTP), Zipkin/Jaeger format, proprietary formats.
Step 3: Batching and exporting
- Spans are batched to reduce overhead.
- Exporters forward them to the tracing backend (Jaeger, Datadog, Tempo, etc.), often over HTTP/gRPC with retries and compression.
Step 4: Backend processing
- The backend correlates spans into full traces, stores them, and exposes them for querying/visualization.
Trace Collection
- There are mainly two ways intrusive (in-app instrumentation) and non-intrusive (agent-level / auto-instrumentation)
| Aspect | Intrusive (in-app SDK) | Non-intrusive (agent/auto-patching) |
|---|---|---|
| Definition | We import the tracing SDK into the app. The library hooks into frameworks (Flask, Django, Spring, etc.) and records spans for requests, DB queries, caching calls, etc. | Non-intrusive doesn’t mean passive sniffing, it still patches runtime/library calls, but without touching application code. |
| Mechanism | Manual instrumentation with tracing API (span.start, span.set_tag). Runs inside the process. | Injects into runtimes (Python, Java, Node, .NET, PHP) using LD_PRELOAD (Linux), JVM -javaagent, .NET CLR profiler, or monkey-patching in dynamic languages. |
| Context captured | Both business + technical: user ID, session ID, customer tier, transaction IDs, error codes, domain-specific tags. | Mostly technical only: SQL query text, HTTP path, timings, status codes. |
| SQL/DB visibility | Full DB span + business context (e.g., “user_id=42 ran this query”). | Intercepts DB client library calls (e.g., psycopg2, mysqlclient, JDBC). Sees SQL query strings because they’re passed as plain arguments to functions before execution. |
| Coverage | Any part of the code you choose: API handlers, background jobs, domain logic, custom error handling. | Only covers known patched libraries: DB drivers, HTTP clients, RPC frameworks. |
| Error details | Full stack traces, custom error messages, domain error codes. | Generic runtime errors (e.g., DB exception, HTTP 500) without business meaning. |
| Flexibility | High, you decide what to trace, where to put spans, and what metadata to attach. | Low, limited to what the tracer can infer automatically. |
| Best use case | When you need business observability: which customers are affected, which orders are delayed, custom KPIs. | When you need fast setup and baseline visibility without changing app code. |
Terminologies
Runtime Metrics
- Allow to view Heap Segment, non-heap memory usage and Garbage Collector activity of the app
- Datadog can have this enabled with
export DD_RUNTIME_METRICS_ENABLED=true
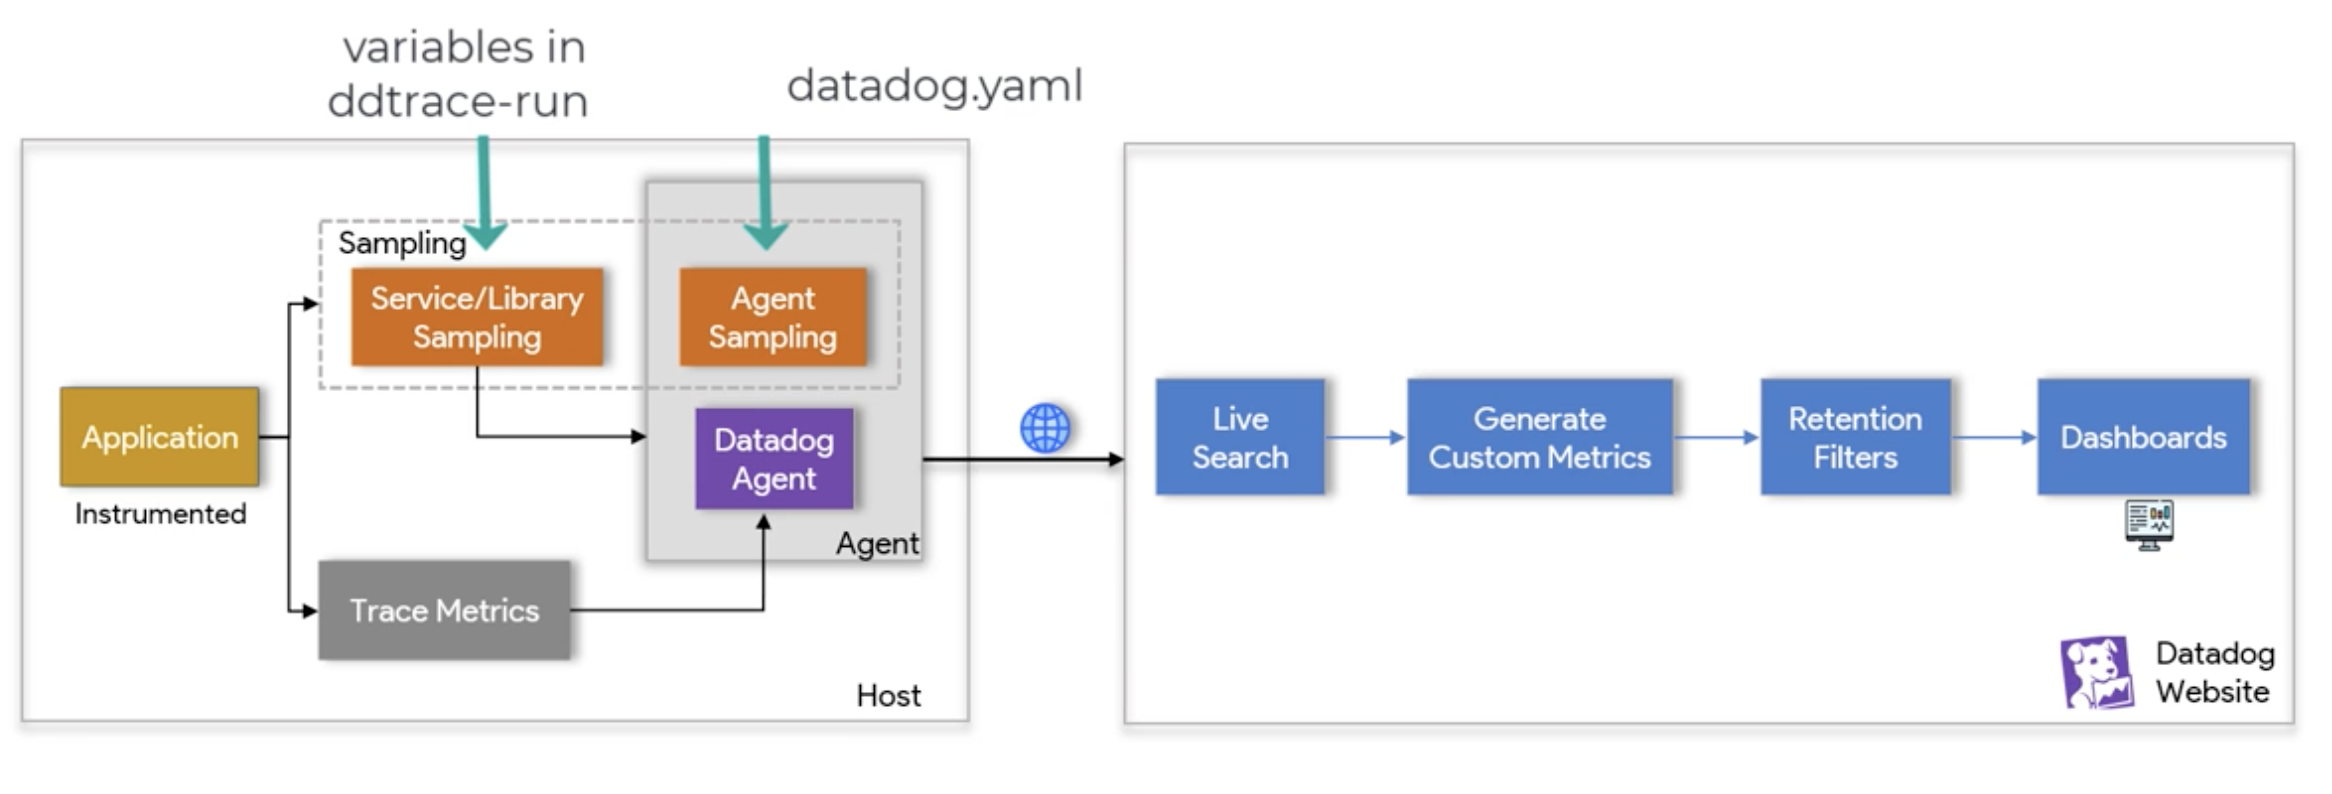
Instrumented
- Code or tools have been added to the application to monitor, measure, or analyze its behavior during execution
- Provide insights into the application’s performance, functionality, and other operational characteristics
- This is particularly useful for debugging, performance tuning, and monitoring purposes
Host-side
- We can tune the Sampling
- Library Sampling overrides Agent Sampling
- Trace Metrics are the Metrics, directly connected Instrumented application, calculated based on 100% of the app’s traffic